I have watched many videos, purchased courses, and programmed a few audio visualizers, but something is still not clicking and it's causing tons and tons of confusion for me. And I think it boils down to the word "sample". Either I am not understanding something, or different people use it in different ways. Or it has multiple definitions depending on context, which makes things worse when trying to learn.
Let me start by a) describing what I'm trying to do and b) what I think I know. And then I'll ask my question.
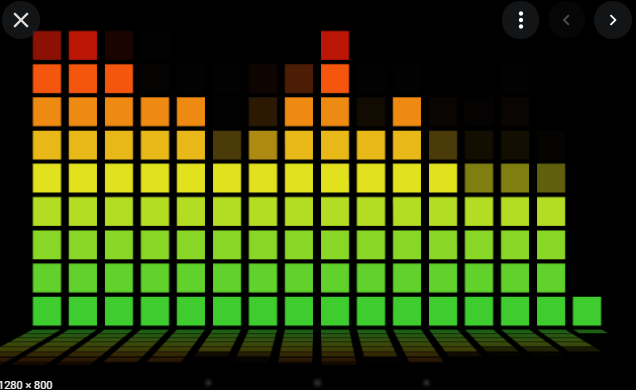
As I briefly mentioned earlier, my goal is to create an audio visualization framework in a video game I'm working on. More precisely, I want to have a list of values where each value is between 0 to 1 and represents a range of frequencies. It's an extremely common representation of audio in many places (see figure 1). Little did I know that it's actually not as straightforward to produce, and that's because, unlike my very early assumption, audio is not stored that way.
Now, given how common this is, there are a plethora of tutorials that walk you through how to do it. But it is precisely those tutorials that seem to cause me more confusion. The code works, I am able to produce the visual I want, but as soon as I need to fix a bug, or alter its logic, I just am lost.
So what do I think I know?
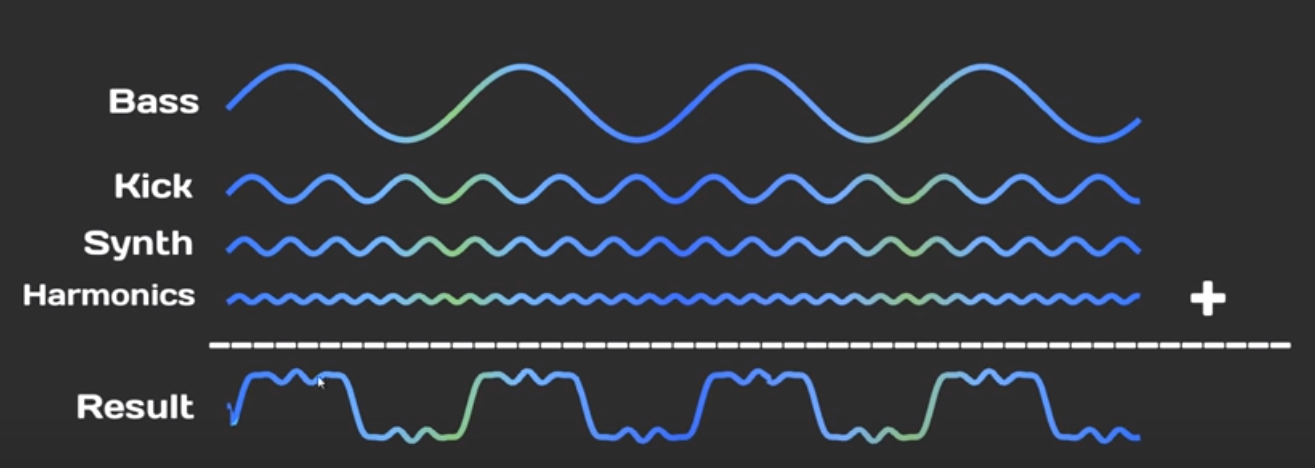
I understand that ultimately audio is stored as a series of values(?) that represent a sine wave. I understand that a sine wave is the sum of multiple sine waves, each of which are of different frequencies (figure 2). I understand that in order to represent a frequency, you have to sample at least double that amount (i.e. if 20kHz is the limit of human hearing, you need to sample at least 40kHz + some room for falloff, thus 44kHz being the standard). The video that explained it made if very clear why we need double. I understand that we use Fourier Transform to deconstruct a single since wave into the multiple sine waves it consists of (more specifically, we receive the coefficients(?) or some other part of the equation of the frequency that we can later mathematically reproduce the sine wave). I understand that bitdepth is how close to the sine wave a value can get (and that anything above 24bit is unnecessary). I kinda think I understand what windows are, but this is where I think I'm starting to lose it.
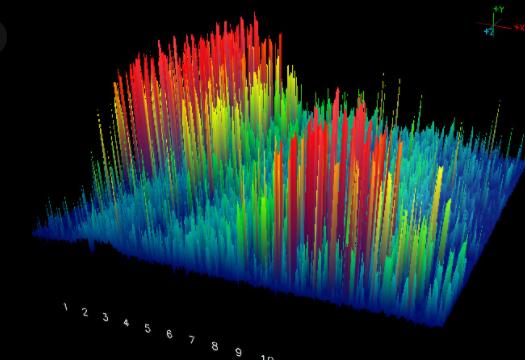
So, from all of the above, and because I really like representing ideas visually, I will start with a visual representation of my understanding. The best representation I've found that relates samples to frequencies is a 3D spectrogram like this:
Moving from left to right (X axis), is time. From bottom to top (Y axis) is amplitude. And front to back (Z axis) is amplitude of a specific frequency.
So, in my understanding, when we sample, we are basically recording a single value from 0 to MAX_BITDEPTH that represents the sum (or average?) amplitude of all the frequencies at that very specific moment in time. Which, on its own, doesn't tell us much. First, we need a wave, and second, we need enough samples of that wave to be able to deconstruct all the frequencies we care for. So, for 20kHz, we take 44,000 samples in 1 second. Right? So the minimum amount of time we need to deconstruct anything, would be 1 second. Right? And because we know that not all sounds start and end at the exact same time, sometimes we... (this is where I start losing things) use multiple samples to represent one? Overlap different samples? Wait... what is a sample again?
I've lost it.
If 44k samples is required to represent 20kHz frequency, then why do so many code examples call an API that returns 512 samples? For example, Unity has a method to receive "spectrum data": AudioSource.GetSpectrumData. This is their example code:
using UnityEngine;


[RequireComponent(typeof(AudioSource))]
public class AudioSourceGetSpectrumDataExample : MonoBehaviour
{
    void Update()
    {
        float[] spectrum = new float[256];

        AudioListener.GetSpectrumData(spectrum, 0, FFTWindow.Rectangular);

        for (int i = 1; i < spectrum.Length - 1; i++)
        {
            Debug.DrawLine(new Vector3(i - 1, spectrum[i] + 10, 0), new Vector3(i, spectrum[i + 1] + 10, 0), Color.red);
            Debug.DrawLine(new Vector3(i - 1, Mathf.Log(spectrum[i - 1]) + 10, 2), new Vector3(i, Mathf.Log(spectrum[i]) + 10, 2), Color.cyan);
            Debug.DrawLine(new Vector3(Mathf.Log(i - 1), spectrum[i - 1] - 10, 1), new Vector3(Mathf.Log(i), spectrum[i] - 10, 1), Color.green);
            Debug.DrawLine(new Vector3(Mathf.Log(i - 1), Mathf.Log(spectrum[i - 1]), 3), new Vector3(Mathf.Log(i), Mathf.Log(spectrum[i]), 3), Color.blue);
        }
    }
}
Notice that is passes a float array of size 256. It is important to know that this is a method of AudioSource, which is responsible for playing audio. So while audio is playing you may call this method at every tick of the game engine, and receive "spectrum data" of that... moment? Of the last 256 samples? Wait... what is a sample again?
I've lost it, again.
When I tried to watch a YouTube tutorial that explains audio visualization, the person said:
"The complete spectrum of Fast Fourier Transform, in this case, could be about 20,000 Hertz. So it would create 20,000 different samples. And that's a bit too high for our game to work with"
source: Audio Visualization - Unity/C# Tutorial
Wait, what??
...
Further down the tutorial series, the author tries to explain how, instead of having 1 bar for 1 frequency, we want 1 bar to represent multiple frequencies. Perfect! That's what I want!! And then they start using the word "sample":
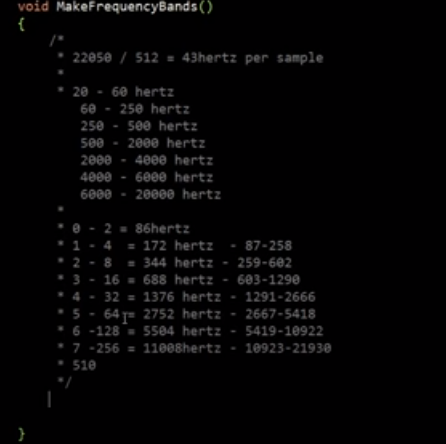
"the song we are playing has a hertz of 22,050. and we have 512 bands. which, if you divide this, it's about 43 hertz per sample"
(╯°□°)╯︵ ┻━┻
Clearly, there is something very fundamental here that is not clicking for me. I feel like I'm missing something extremely obvious that I just need somebody to show me for it to click.
Please somebody help! What am I missing? What is a sample?
Thank you in advance.


